swell, the title of the post may sound miss leading but actually thats what it is and in this post I am going to share how to plot data from sensors google Line Chart in realtime with no sql involved . I pretty much figured it out months back when I first had a look at setInterval function of javascript and google graph API, all this time I was spending time with google gauge, so this weekend I played with Google Line Chart.
I was displaying the temperature and humidity from outdoor and indoor on google gauge(see here). However the only disadvantage of it is every time you will get to see the latest values and you have no straight away way to see the old values, so I was thinking lets spend this weekend with Google Line Chart while some of my fellow office colleagues are away walking for a noble cause.
I was displaying the temperature and humidity from outdoor and indoor on google gauge(see here). However the only disadvantage of it is every time you will get to see the latest values and you have no straight away way to see the old values, so I was thinking lets spend this weekend with Google Line Chart while some of my fellow office colleagues are away walking for a noble cause.
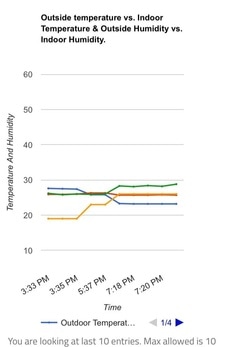
on right you are looking at the mobile view of the graph I implemented with lots of digging, researching and reading google Chart Docs . The docs helped me a lot while I was trying hit and try to see what happens with attributes and customisation settings shown on the page.
for little bit of optimisation I use javascript function to detect if the platform the page displaying graph is mobile platform or a desktop. And based on which I adjust the settings of graphs.
for little bit of optimisation I use javascript function to detect if the platform the page displaying graph is mobile platform or a desktop. And based on which I adjust the settings of graphs.
1 2 3 4 5 6 7 8 9 10 11 12 |
(function (window) { { var unknown = '-'; // browser var nVer = navigator.appVersion; // mobile version var mobile = /Mobile|mini|Fennec|Android|iP(ad|od|hone)/.test(nVer); } window.jscd = { mobile: mobile, }; }(this)); |
Have a look at the graph displaying data in realtime from the sensors connected to Arduino Mega running web server using Ethernet shield. And since its realtime and data is updated every minute based on setInterval function there is no use of sql or any dbms. I believe we only need to punch data into database if we have to do some research or analysis further based on the data. Or if you want to learn about databases .
 RSS Feed


